- Cover sheet (pdf)
- Print version (pdf)
- Starter code: (all together:
proj6.tar.gz)
This project contains both written and electronic (programming) parts. The electronic parts (code) must be submitted according to the instructions on this page. The written parts must be typed or neatly written, and handed in to the instructor.
Both parts of this project are due before the beginning of class on Wednesday, April 18. Late submissions will not be accepted, in accordance with the class policy. Students with excused absences on that date may email the written portion by the deadline in addition to handing in a paper copy at the earliest opportunity.
Coding Guidelines:
- It should be clear what your code is doing. The best way is to use sensible variable/function/class names, and to clearly state what every non-trivial chunk of your code (function, long loop, long block) does.
Your program will be tested by an automated script before I even look at your code. This means that
- Your program must compile without errors, on the CS Linux environment. If you use my included makefile, you should be able to run
makeand thenmake cleanwithout any errors. I recommend making back-up copies frequently in case you break something and can't figure out how to fix it. Commenting out half-working code may garner some partial credit. - Your program must behave exactly as I have specified. Extra messages like "hi prof" are nice and friendly, but they will confuse my auto-testing script and cost you dearly. When arguments are specified on the command line, they must come from the command line, and when input is specified to come from standard in, it must come from standard in.
- Your file and folder names must be exactly as specified as well. Yes, this includes capitalization. For this project, I'm giving you starter code for everything, so you shouldn't have to change any file names.
- Your program must compile without errors, on the CS Linux environment. If you use my included makefile, you should be able to run
Follow the course honor policy: document any external sources, and don't produce or look at any code in collaboration with anyone other than your instructor.
1 Overview
In this project you will implement the algorithmic backbone of a new web service called "Frugal Maps". The key problem is essentially a preprocessing/query task where the queries specify endpoints to find shortest paths in a graph. The main difference is that each edge will have two weights instead of one, and the actual "length" of each edge will be different for each query, depending on an extra parameter that is given with each query. (If none of this makes sense, just read on.)
Here's the idea behind "Frugal Maps". There are a variety of services available to find the fastest driving route, or flight plan, or bicycle path, etc. Some of these services also display information about the relative price of the different routes. This price might include applicable costs such as airfare, gasoline, tolls, whatever. What "Frugal Maps" is going to do is automatically correlate these two weights (time and price) according to how valuable the user's time is, and give the best route for that individual. So the input for each query will be the starting and ending points, as well as the "cost of time", which is the number of dollars (cost units) that each unit of time (say, hours) is worth.
An example should help clarify the situation. We have five cities (a,b,c,d,e), each of which is a node in the graph, and some routes (edges) between them. Each edge is labeled with a pair of weights \((t,p)\) that represent respectively the time and price of that particular journey. For this example, and for the problem you are solving, all the weights will be non-negative integers.
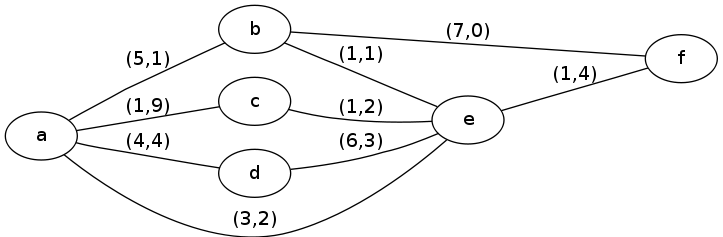
Example Map
You can see in this example that, even for the same desired starting and ending points of a and f, there are multiple possibilities for what the shortest path will be depending on the "cost of time":
| Cost of Time | Shortest Path | Weighted Cost |
|---|---|---|
| 0 | a, b, f | \((5*0 + 1) + (7*0 + 0) = 1\) |
| 2 | a, e, f | \((3*2 + 2) + (1*2 + 4) = 14\) |
| 100 | a,c,e,f | \((1*100+9) + (1*100+2) + (1*100+4) = 315\) |
You may also assume that the "cost of time" is a non-negative integer, which will always be between 0 and 500. Note: this upper bound of 500 might be important to you!
2 Specifications
You must write a C++ program called drive.cpp that implements your algorithm for solving "Frugal Maps" queries. The program will first read in a description of the graph from a file (specified on the command line), and then read a series of queries (shortest-path requests) and respond to each one as they are entered.
The graph is stored in the following format:
n m
node_1
node_2
node_3
...
node_n
u_1 v_1 time_1 price_1
u_2 v_2 time_2 price_2
u_3 v_3 time_3 price_3
...
u_m v_m time_m price_m
Here n and m are the number of nodes and edges in the graph, respectively. node1 through noden are the names (labels) of the n nodes. Finally each line of the form u v time price specifies an edge in the graph between the vertices named u and v, with the two weight functions as specified.
You can generate random graphs in this format by using the included gengraph program (see below for further details).
After reading the graph from the file named on the command line, queries are read in one at a time from standard input. Each query is of the form u v timecost, where u and v are node labels, and timecost is the "cost of time" as discussed above.
You can generate random queries for a given graph by using the included genreqs program (see below for further details).
The response to each query (and indeed the only thing your program should ever print unless there is an error) is a line of the form u w1 w2 ... v leastcost, where every w1, w2, etc. is a node along the shortest path from u to v, and leastcost is the total cost of that shortest weighted path for the given query.
You can see correct (albeit extremely slow) behavior by running the included drive program (see below for further details).
Here is an example session showing exactly how the drive program you write should ultimately behave. This is exactly the same example as the picture and table above.
p6$ make drive
g++ -O3 -Wall -Wno-sign-compare -c drive.cpp
g++ -O3 -Wall -Wno-sign-compare -o drive drive.o
p6$ cat > graph.txt
6 9
a
b
c
d
e
f
a b 5 1
a c 1 9
a d 4 4
a e 3 2
b e 1 1
b f 7 0
c e 1 2
d e 6 3
e f 1 4
p6$ ./drive graph.txt
a f 0
1 a b f
a f 2
14 a e f
a f 100
315 a c e f
3 Deliverables
Before the beginning of class on Wednesday, April 18, the following two problems must be answered on paper and submitted:
Describe your algorithm at a high-level. Basically, say how your program works. I don't need to have every detail explained, but you should say the general approach, including any algorithms, subroutines, or techniques you use that we saw from class. Pseudocode is not required, but you can submit it if that will make the description of your algorithm clearer.
Analyze the asymptotic worst-case running time of your function, in terms of the THREE parameters m, n, and the number of queries k. Try to be as accurate as possible, but it is OK to give just an upper bound (big-Oh) if you have some heuristic or complicated improvements in your program.
Before the beginning of class on Wednesday, April 18, you must also submit a folder named proj6 that contains the following files:
drive.cpp: This is your top-level program (with amainmethod) and will contain all the code that you write.Makefile: Typingmake driveshould compile your source code to an executable nameddrive.
If you want to include some code in helper files, you must also submit a README.txt file that explains how your code is organized. Otherwise, everything you write should be in the drive.cpp file.
You may include any other files in your submission, but I will ignore them.
4 How you will be judged
Your grade will be roughly half "soft points" for the hand-graded things such as the written problems, as well as your coding style, documentation, clarity, organization, etc. The other half will be "hard points" based on how well your algorithm actually performs in a series of tests.
The tests I run will have various sizes of n, m, and k (the number of queries). However, you can expect in general that the graph is dense (so m is close to \(n^2\)), and the number of queries vastly exceeds the size of the graph (i.e., k is much larger than m). For example, a good benchmark to target might be \(n=100\), \(m=2000\), and \(k=100000\). The starter code I gave you has no hope of ever finishing on this problem, whereas the (very hastily produced) sample solutions I wrote completes in less than 4 seconds, and with a maximum resident set size of about 150MB.
See below under "resources" for some tools you can use to time your program in the same way that I will.
Because a large part of your grade is coming from automated testing scripts, it is absolutely imperative that your output be in the correct format and that it be accurate. However, there may be some partial marks given for responses that are partially correct, such as:
- Correct minimal path length, but incorrect path
- Correct minimal path, but incorrect path length
- Valid path and correctly matching length, but not optimal
However, I emphasize again that it will be difficult to receive a good grade if your program produces extra output, or incorrectly-formatted output, or has compile/run-time errors, etc. As always, I recommend saving partial progress frequently, starting early, asking for help as needed, and so on.
There will be some extra credit points built into the automated tests. I look forward to seeing your creative and brilliant ideas. Keep in mind that there is not a single "correct" answer, nor is there even a single algorithm or approach that I have in mind exclusively. Using the benchmark described above as a guide, your goal is simply to make the fastest, correct program.
5 Starter code and test case generators
Here I will briefly describe what is in the three programs given to you, drive.cpp, gengraph.cpp, and genreqs.cpp. Of course the best place to look to understand a program is in the source code itself!
drive.cpp is the main program that you will need to modify, as you know. I have written pretty much all of the I/O for you, storing the graph as a pair of adjacency matrices (one for each of the two weight values). The value -1 is used to indicate an edge that is not in the graph.
The starter code provided for you in drive.cpp also contains a correct solution for the problem. That is, it will always (eventually) return the exact shortest path solution. However, this algorithm has been intentionally designed to be as slow as possible, as you can see by running even a moderately-sized example with m above 50 or so. The current approach is to do a complete depth-first exploration of the tree, searching every possible path from the starting vertex as each query is read in. (Note that the total number of possible paths in a graph grows exponentially with the size of the graph.) And actually this exponential-time depth-first exploration is performed twice: first to find the length of the shortest path, then to find the actual path. So while this might be useful to test your program for some small examples as you begin to develop it, it is not sufficient for a good grade to merely do better than the included starter code.
The gengraph.cpp program creates a random unweighted graph and writes it to the filename specified on the command line. Also specified on the command line are the number of vertices in the graph n and the number of edges m. Node labels will be the first n lines from the cities.txt file, which contains the 10000 most populous cities in the United States. These will be put into a random order, and then edges will be randomly chosen to fill in the graph itself. The edge selection algorithm works by first choosing edges to make a random spanning tree, so that as long as \(m\ge n-1\), every vertex in the graph will be reachable from every other vertex. Both edge weights will be at least 0 and at most 400. This guarantees that the weighted length of any path in any graph created with this program is less than \(2^{31}\), and therefore you should be able to perform all your computations in ints.
Finally, the genreqs.cpp program takes in a value for k and the name of a graph file as command line arguments, and generates random queries for the drive program based on that graph. Each query will just be a pair of randomly-chosen nodes from the graph, and the "cost of time" number chosen randomly from 0 up to 500.
Here is an example test run showing me using these functions to test my program on the "target benchmark" indicated above:
p6$ make all
g++ -O3 -Wall -Wno-sign-compare -c drive.cpp
g++ -O3 -Wall -Wno-sign-compare -o drive drive.o
g++ -O3 -Wall -Wno-sign-compare -c gengraph.cpp
g++ -O3 -Wall -Wno-sign-compare -o gengraph gengraph.o
g++ -O3 -Wall -Wno-sign-compare -c genreqs.cpp
g++ -O3 -Wall -Wno-sign-compare -o genreqs genreqs.o
p6$ gengraph 100 2000 graph.txt
p6$ genreqs 100000 graph.txt > reqs.txt
p6$ /usr/bin/time ./drive graph.txt < reqs.txt > output.txt
3.68user 0.26system 0:03.94elapsed 100%CPU (0avgtext+0avgdata 162496maxresident)k
0inputs+10520outputs (0major+10210minor)pagefaults 0swaps
6 Hints and Tips
NOTE: This section may grow as time goes on. (I will announce any additions during class.)
- There are basically two algorithms that we saw in class for shortest-path computation: Dijkstra's (possibly repeated for all-pairs), and Floyd-Warshall. Either one or both might be applicable here, although obviously neither of them will solve the double-weights issue. However, these algorithms would be the most sensible place to start your thought process for how to tackle this problem.
- Remember that there is not a single correct answer. You might have to try something, then discover experimentally that it doesn't work, and try something else. All the more reason to START EARLY!
- It may be helpful for me to remind you that the "cost of time" value is guaranteed to be an integer between 0 and 500, and that 500 is a constant.
- Once you get some solution working, even a really slow one, be sure to back it up in case your next improvement attempt fails.
- Since you know the number of queries will be much larger than the size of the graph, this suggest that doing some precomputation on the graph might be helpful to speed up the whole program.
- The efficient use of memory will probably be a KEY component in any successful solution. Keep thinking about how you can store and access your data more efficiently.
- You are encouraged to use the provided C++ standard libraries, including the standard template library (STL). This library provides a number of very useful container classes and even some basic algorithm implementations. See the links under "Resources" below.
- If something is confusing/unclear/frustrating, ASK ME ABOUT IT! It's my job to help you!
7 Resources
NOTE: This section may grow as time goes on. (I will announce any additions during class.)
The following are a few resources that may be helpful to you in completing this project successfully. They are by no means required to be used.
The *nix
timeutility. This is what I use to actually measure the performance of your programs (time and memory used). There is a built-intimecommand in the bash shell, but the one in/usr/bin/timeis actually better in my opinion.You run it by typing something like
/usr/bin/time -v ./drive graph.txtwhich would run the program
./drive graph.txtand then report information about what resources were consumed. The two to really look out for are User CPU time, System CPU time, and maximum resident set size (memory usage).Setting resource limits. I will probably test your code with some maximum resource limits, such as say 500MB of memory. The tool to do this is called
ulimit, and it is a bash shell built-in function. Unfortunately, the "limits" that are set are sometime ignored by different programs, but it works fairly well in Linux when running C++ programs. Runhelp ulimitin bash to see a run-down of the different available options.C++ Standard Template Library. Remember all those useful built-in classes and utilities in Java that don't seem to exist in C++? Well, many of them do exist in a magical land known as the STL. Examples are stacks, heaps, queues, sorting, maps (balanced binary search tree), etc. There are numerous good online resources: this SGI page is very nice, and I also like the way this one from cplusplus.com.
Valgrind. This is a free software program that is used by "real" programmers all the time to profile and debug their code, usually to find memory leaks in C/C++ code. It should be installed on the Linux machines in Michelson by the end of this week. See the quick start guide for a basic run-down of how to use it and what it tells you. Very useful tool in general, but it is a "real" tool so it might take a little adjusting on your part.
As a general tip, because you have to compile with special flags in order to use valgrind, it's a good idea to do a
make cleanfirst to delete any compiled products you have, then go change the first line of theMakefileaccordingly, then compile again, and finally run your compiled program through valgrind as recommended on their web site.